

Ho hum, Chalk-Up Another Record Year. . .

Cindy Engel
As team co-founder, working with sellers, buyers, and investors for real estate comes easily to Cindy...
As team co-founder, working with sellers, buyers, and investors for real estate comes easily to Cindy...
Just another record setting year for Metro Denver's 11 county housing market . . .
Don't Sell or Buy Without Reading Our New Denver Market Report - because the market IS shifting!

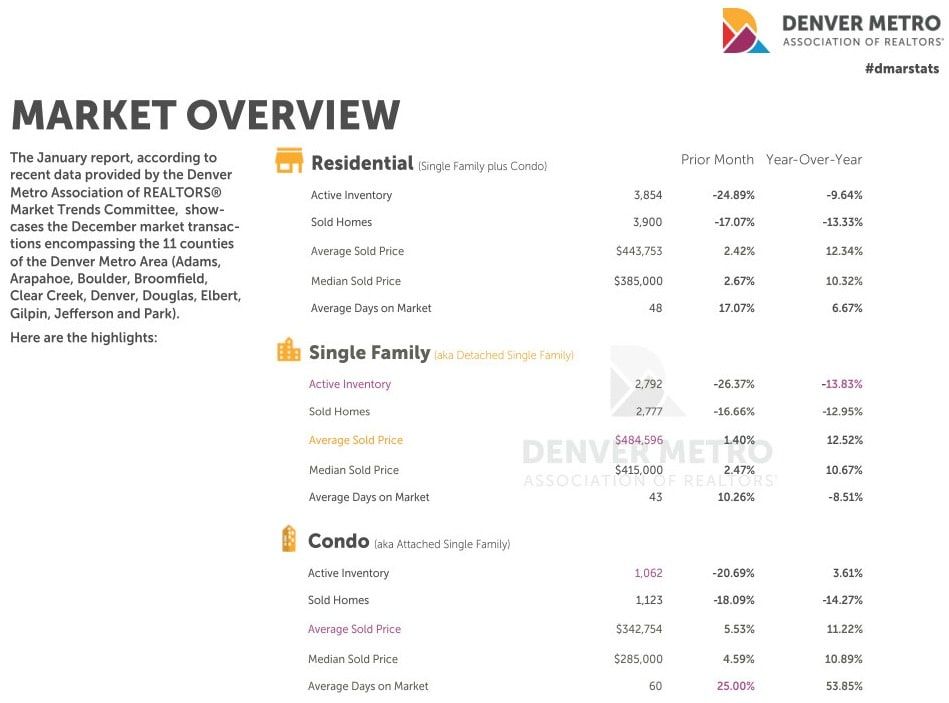
In 2017, more homes were sold for higher average and median prices than ever before, finishing the the year with the lowest amount of active listings on record for 11 counties in the greater Denver Metro area.

Sellers are in the sweet spot: The big winners in 2017 were the home sellers, and sellers should experience continued success in the New Year. The days of double digit appreciation are in the rear-view mirror as the rate of price growth continues to slow. As affordability applies pressure on the housing market, more opportunities will present themselves to homebuyers. The lack of active listings should concern everyone. Only time will tell if more sellers will choose to stay in their current homes, afraid that they won't be able to find a replacement.
Looking deeper into the numbers: Active listings in the residential market (single-family and condos) was at 3,854 total units in December. This establishes a new all-time low for any month. The number of sold listings decreased by 17.07% compared to the previous month and dropped 13.33% from last December. Year to date, the number of homes sold set a record closing out the year at 57,788 homes - up 2.93% from 2016. In 2017, a new record was set in closed volume topping $25 billion - compare that to 2011 when just $9.9 billion was sold.
The condo market saw another large jump in days on market, increasing to 60 days compared to 39 last December. The most active price segment for the single-family market continues to be $300,000 to $399,999, and $200,000 to $299,999 for condos. Months of inventory fell to 1.01 months for single-family homes and 0.95 months for condos. According to the National Association of Realtors, a balanced market is considered to have at least 6.5 months of listing inventory.
As we look at the single-family home market, the average sold price increased 1.4% month over month to $484,596, while the median price also increased 2.47% to $415,000. Both the average and median year-to-date sold price set new record highs. The year-to-date average sold price hit $480,140 for the single-family home market, up 8.69% from last year, with the median sold price at $410,000 and up 7.89%. The condo market did even better with the average sold price reaching $318,904, representing a 10.04% increase over 2016. The median price of condos sold also increased by 12.15% to $270,000.
What does median look like? Of the homes that sold in December 2017, the median detached single-family home was 1,752 sf, 4 bedrooms, 3 bathrooms, spent 17 days on market and was built in 1984. The median attached single-family home/condo was 1,221 sf, 2 bedrooms, 2 bathrooms, spent 14 days on market and was built in 1986.
Final Thoughts: History tells us that December is the slowest time of the year for homes going under contract. Several factors contribute to this: chilly weather, less daylight, holidays and people taking time off to shop, ski, etc. Don't expect things to pick up, especially listings, until after February.