


Historic Destruction of Household Wealth

Bob Engel
As a real estate professional with over thirty-five years of national real estate experience, Bob has the strong industry knowledge rarely found in re...
As a real estate professional with over thirty-five years of national real estate experience, Bob has the strong industry knowledge rarely found in re...
Homeownership Your Inflation Hedge
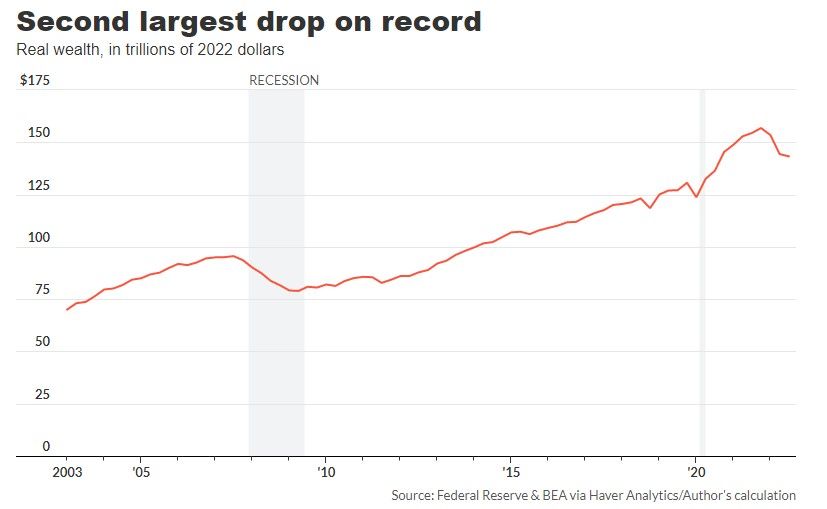
The $13.5 trillion loss of household wealth in the first three quarters of this year was the second worst in recorded history falling. The Federal Reserve’s release last Friday of quarterly financial accounts, reported that American households lost $6.8 trillion in wealth in the first three quarters 2022, as the stock market lost more than 25%.
The nominal net worth decreased 4.6% to $143.3 trillion as assets declined by $6 trillion and liabilities increased by approximately $900 billion. The 10% increase in home equity (assets less liabilities) supported the balance sheets of households. This is the largest source of wealth for most American families.
The real wealth loss from January to September was almost twice that of the nominal loss, $13.5 trillion in current dollar terms. This is after accounting for the high inflation this year. Inflation reduces the purchasing power of both liabilities and debts.
The 8.6% decline in real wealth in three quarters represents the second-fastest decline (data series began in 1959). The 2008-09 financial crisis saw the only larger drop in real wealth. (If we had the data, the wealth that was lost in the Great Depression of 1930s would be the record.
1. Balance Sheets healthy... at Least for Now.
After adjusting for inflation, the real household wealth was still about 10% higher than in late 2019 just before the COVID-19 pandemic.
The aggregate household balance sheets remained in good shape despite losses on Wall Street, and the erosion of purchasing powers. The share of wealth as an annual disposable (after tax) personal income fell slightly to 769%. This is not far from the record 825 percent in the first quarter.
The liabilities at $18.8 trillion were only 103% of annual disposable incomes. This is far lower than the peak of 136% in 2008 when the housing bubble burst. Realistically, liabilities are now lower than they were in 2008, despite a much larger economy.
As September ended, homeowners were financially healthy, with equity in their homes rising to an all-time high of 70.5% from a record 46% in 2012. If home prices continue to drop as they have in recent months, homeowners who are not exposed to the stock markets will feel less secure. The policy makers and homeowners are still uncertain about what will happen to home values as mortgage rates rise.
2. Taking on more debt.
As household debt is starting to rise, warning signs are also being spotted. After a decade without inflation-adjusted debt growth, real household debt saw an increase of 4.3% annually in the third quarter. This is the fastest rate since 2007.
Consumers are increasing their debt and drawing down their savings to sustain their standard of living. One measure in the Fed report shows that the personal savings rate is now 3.7% of disposable income. This follows a 10-year average of more than 10%.
However, household cash reserves are still large. The bank accounts and money-market fund are still full of more than $18 trillion worth of relatively liquid deposits. This is nearly enough to pay off all the debt households have.
However, people who are in debt and people with millions of dollars in the bank may not be the same.
Next week, the Fed will provide additional information about the financial accounts, including the distributions of assets and liabilities according various groups such as income, wealth, age, race, education level and income. Even Fed economists are skeptical about the accuracy of these distributional tables because the pandemic has disrupted everything.
3. If you can, follow the money.
Really, really beautiful. The homes that get multiple offers are those with look, feel and function that can be described in one word: covetable. You're not trying to create a situation in which your home barely edges out the listing down the street in the hearts and minds of your target buyer. If you want multiple offers, you need multiple buyers to fall deeply in love with your home – enough to bid above the listing price, and enough to compete with others for it.
To generate multiple offers, prepare your home by ensuring it is: immaculately cleaned from the inside out – closets, basements, garages and crawl spaces included, de-cluttered and staged to the nines – this includes fresh paint, carpet and other things that need replacing in perfect working order – make sure things like doors, windows and systems buyers test (e.g., stoves, faucets, heating and air conditioning) are not creaky, wonky, leaky or otherwise dysfunctional.
If you've done any major home improvements or replaced any appliances or systems lately, market that! Show off how immaculate, adorable and move-in ready your home is now – and tout its great working condition for the long run.
4. Homeownership is an inflation hedge.
The real estate market is not in jeopardy of crashing in the foreseeable future. Underlying pent up demand and lack of inventory will continue to fuel appreciation well into the future before the market finds any point of equilibrium.
While it is true that real estate sales have decreased by 30% due to mortgage rates that skyrocketed to over 7% (+2x increase) in only five months earlier this year after the Fed’s combined 375bps in rate hikes this year in an intentional effort to slow the economy. But real estate is still appreciating, although be it at a slower rate than the crazy double digit annual appreciation we saw following the pandemic which was fueled by what else… pent up demand and lack of inventory.
Current estimates are that residential real estate appreciation has slowed currently to about 9.3% with future appreciation forecast in a range of about 4% to 6% per year. Mortgage rates have retraced a bit and currently hover around 6%, however many first-time home buyers are priced out of the market until rates decrease which will may not be any time soon.
5. How much is your home currently worth?
With a our rapidly shifting real estate environment it's very difficult to stay up with the economy, market rates, inventory and home prices. If you’re thinking about selling your home or just planning for the future, having a good understanding of what’s going on in our local market is vital.
Being aware of the data such as the average sales price, the number of homes sold, and average days on market will better arm you with the knowledge you need to make an informed decision about listing your home.
Our December market report showcases everything you need to know about local real estate trends.
Plus, you can also check out the top 10 homes that hit the HIGHEST sales to list price percentage in Denver metro for the month of December
Selling Your Home?
Get your home's value - our custom reports include accurate and up to date information.